Stardust
The Alpha Centauri star system is the nearest star to our sun. Even so it’s a tad less than 4.4 light years away. That might not seem like much, but it’s 25,800,000,000,000 miles or 41,500,000,000,000 kilometres. It’s impossible to get a grasp of how big these numbers are without comparing it to something else. So if one second represented a kilometre, 41.5 trillion of them would be 1.3 MILLION years. If we could travel at one tenth the speed of light we would take 44 years to get there. Which is exactly what NASA is planning to do in 2069. It has to play a long game because the technology to achieve this speed doesn’t exist yet. One tenth of the speed of light is over 100 million kilometres per hour.
Despite the problem of getting even to the nearest star, let alone the rest of the galaxy, we still know a great deal about the Alpha Centauri system and most of the stars visible in the night sky. How is this possible when they are so out of reach?
The answer is spectroscopy, and it is a wonderful example of an observational technique that builds understanding at a seemingly impossible distance. In spectroscopy we observe the interaction between atoms and electromagnetic waves. So first I have to describe the characteristics of these two players that allow us to understand the nature of distant objects.
Electromagnetism is one of the ways energy is transferred from one place to another. It can do this as a wave or as a particle. Its called the wave/particle duality, and the particle is called a photon. I don't propose to cover this duality here as it is not essential in describing the way spectroscopy informs us about the universe.

Wavelength of an electromagnetic wave. Source - WIkimedia, Ysangkok at English WIkipedia
Electromagnetic waves
Light is an example of electromagnetic waves. Sir Isaac Newton first famously split light into its rainbow colours in the 17th century. The reason why light comes in different colours is that the wavelength of light varies. Wavelength is the distance between two adjacent crests of a wave (left). The colour with the longest wavelength is red. We can fit 1,500 of these into a millimetre. We then go through orange, yellow, green, blue and indigo, until we reach violet, which has the shortest wavelength in visible light. We can fit 2,500 of these into a single millimetre. Electromagnetic waves carry energy and different wavelengths have different energies. The shorter the wavelength, the greater the energy.

Electromagnetic spectrum showing the type, wavelength, frequency and temperature. Source - Wikimedia, Inductiveload, NASA
We can get a lot of information about the stars from just visible light, but this is only the beginning. Visible light is a really small part of the range of wavelengths (left). The full list of wave types starts at the short high energy end with gamma rays. We could fit around 100 million of these into a millimetre. That’s less than the diameter of an atom. Then we have X-rays, Ultraviolet rays, visible light, infrared rays and microwaves until we get to radio waves. Radio waves can be as much as 100,000 KILOMETRES between crests. So you can see that the range is enormous.
Atoms and molecules
Atoms come in 92 stable flavours ranging from the lightest, hydrogen, to the heaviest, Uranium. These atoms react differently to the different wavelengths of the electromagnetic spectrum, mainly because each atom has a different mass and outer shell. So we have wildly different electromagnetic waves striking any one of 92 different kinds of atom and a very large number of atomic combinations as molecules. Molecules have very distinctive spectral identities. It is from this that we are able to gather information at a distance by observing the consequences of these interactions.
Colours in visible light
The best way to illustrate this is with the familiar colours we see all around us. In visible light atoms absorb some wavelengths and reflect others. We can only see the wavelengths that are reflected back from the atoms or molecules. If we look at the light spectrum of an object the wavelengths that are absorbed will show as dark lines (see below). Essentially, different elements or molecules absorb and reflect different parts of the spectrum and this reveals the identity of the element or molecule when we look at the light spectrum for a distant star.
In the first half of the 19th century a number of people studied the dark lines that appeared in the light spectrum of the sun. By the middle of the century they had worked out that the dark lines represented the colours absorbed by different elements, the colours we are not seeing. The image below shows the Fraunhofer lines, named after Joseph von Fraunhofer, who systematically studied them in 1814. In other words we are identifying something at a distance by the absence of something else (specific wavelengths). It’s similar to Sherlock Holmes solving a crime because the dog didn’t bark.

The Fraunhofer lines in the spectrum of the Sun. Source - Wikimedia, FraunhoferlinesDE.svg, Cepheiden, Eric Bajart
The letters along the top are his designation for the thickest lines, with lower case letters for some of the thinner lines. Because atoms generally absorb more than one wavelength, their lines appear in various places. Also some colours are absorbed by more than one kind of atom; so different atoms share some dark lines. It is the combination of lines that reveal the presence of a particular element.
This list is not exhaustive but shows how we can work out which elements are in the solar atmosphere. We can even work out the proportions of each element. The great thing about this is that it doesn’t matter how far away a star or galaxy is, we can still figure out its elemental composition. Even better, each star has a unique combination of elements and in unique proportions, so it serves as a fingerprint, or more appropriately a bar code for that star.
The interior of a star is in constant motion with convection currents. The elements present in the interior of a star, particularly the nuclear fusion at it centre where heavier elements are being created, is intimately related in this way to the elements present in its outer atmosphere. The combination of the mass of a star and its outer atmosphere give us an idea of what is happening at the core and at what stage the star is at in its evolution. We can then group stars into different classifications where their past and future are reasonably well understood.
While sitting here typing this in May 2018, a news item flashed up somewhere else on my unreasonably large computer screen. This piece of news is a timely example of just how deeply into the universe we can go to identify elements, and how important such discoveries can be in profoundly modifying our understanding. It’s also spookily coincidental.
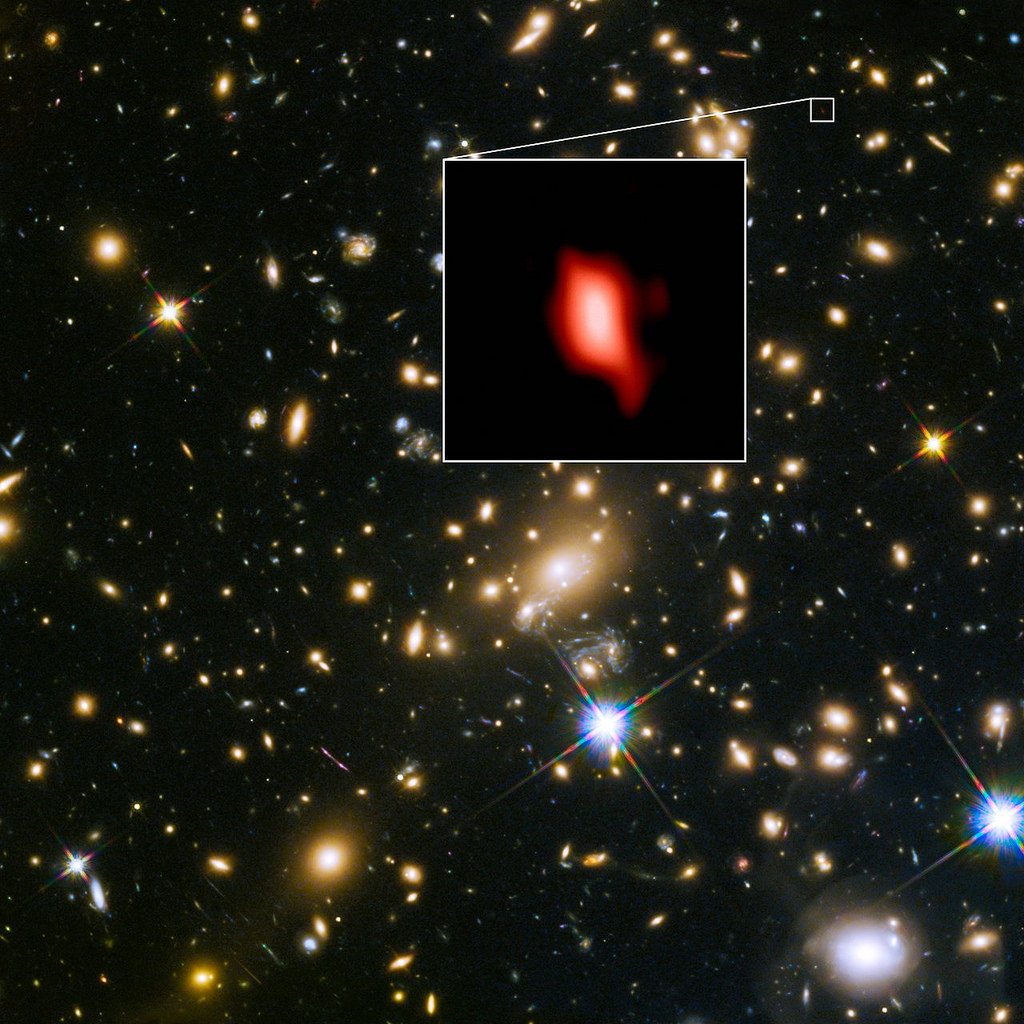
Hubble Space Telescope image of galaxy MACS1149-JD1, where oxygen was unexpectedly detected. Source - Wikimedia,ALMA (ESO/NAOJ/NRAO), NASA/ESA Hubble Space Telescope, W. Zheng (JHU), M. Postman (STScI), the CLASH Team, Hashimoto et al.
The news item says that astronomers have just reported detecting oxygen in an early galaxy. This is significant because the universe before the formation of stars only consisted of hydrogen, helium and a small amount of lithium. For oxygen to be present there had to be stars, and some of them must have died, flinging their elements into interstellar space, where they can be detected here on Earth. The galaxy in question, with the inspiring name of MACS1149-JD1 is 13.3 billion light years away, so we are seeing it as it was only 500 million years after the start of the universe. The only way that this is possible is if stars started forming around 250 million years after the big bang. This is a lot sooner than we previously thought and the timeline of the early universe will have to be significantly revised. It is amazing to think that the simple detection of an element in an object 125,000 billion billion billion kilometres away can add so substantially to our comprehension of the universe.
OK so that’s visible light: What about the rest of it?
Gamma and X rays
These two overlap quite a bit and both are used to identify and analyse the most violent events in the universe; Supernovae, hypernovae, pulsars, and black holes. Violent cosmic events produce the heavier elements in the course of which these high energy waves are produced. The stars themselves, before they explode, can only make a few of the lighter elements, and it is only the most massive stars that can get as far as iron (element 26 out of 98 naturally occurring). All the others are the result of violent, explosive events. This is how we know that our own sun is a second generation star, formed from the debris of first generation supernovae. If this was not so we would not have those heavier elements here on Earth.
Studying these high-energy wavelengths allows us to work out a number of things:
What type of star existed before it blew up.
The location and size of black holes.
The very dense remnant stars otherwise hidden by the supernova debris.
Identify hidden metals and minerals in asteroids for future mining.
Exploring the universe at these high energies allows us to observe and understand the most exotic objects in the universe, some of them invisible to normal light.

This shows the same galaxy observed in infrared, optical and ultraviolet light. Source - Wikimedia, ICRAR/GAMA and ESO
Ultraviolet and infrared radiation
These two lay either side of the visible light spectrum. Ultraviolet is hotter and more energetic, while infrared is colder and less energetic. If we could see the sky in ultraviolet light, most stars would fade into the background and older or younger stars would be more prominent. This is because stars, and galaxies, are hotter at the beginning and end of their lives. Ultraviolet observations also give us information about an objects density and temperature, and about how galaxies evolve.
The main advantage of infrared spectroscopy is its ability to see things that are obscured by interstellar gas and dust. Its discoveries are so wide ranging that several space telescopes are devoted to it.
We can identify molecules in colder regions of space, including carbon dioxide and water.
In a reverse from using ultraviolet light we can make the cooler stars more prominent instead of the hotter ones.
Stars form from within gas and dust clouds from earlier supernovae. Infrared spectroscopy can penetrate these clouds and observe star formation directly, including analysing the composition of the material surrounding the embryonic star, from which its planets will form.
We are able to see into the centre of galaxies, including our own.
Probably the most exciting observation using infrared radiation is finding organic molecules in interstellar space and in comets.

Microwave background map of the universe. Source - Wikimedia, NASA/Goddard/WMAP Science Team
Microwave radiation

The very early stage of the development of a solar system HL Tauri. Source - Wikipedia, ALMA (ESO/NAOJ/NRAO) - http://www.eso.org/public/images/eso1436a/ http://www.eso.org/public/archives/images/large/eso1436a.jpg
The acclaimed discovery using microwaves has been the Cosmic Microwave Background (CMB). This is the remaining heat energy of the big bang. It is the main component of the “snow” on old TVs and the hiss on radios between stations. The mind-boggling temperatures at the start of the universe are now reduced, after 13.8 billion years, to a mere 2.73 Kelvin. The Kelvin scale, named after the physicist Lord Kelvin, starts with absolute zero at minus 273.16 degrees C. Temperature is just the consequence of atoms in motion: The more frenetic the atoms, the higher the temperature. Absolute zero is the point at which the atoms have completely stopped moving. The CMB is therefore 270.43 degrees C below freezing, so if you think its cold where you are the atoms around you are still frantically jitterbugging away. The main interest with this is that the map of the CMB universe is not smooth, but shows structure (see above). Galaxy location appears to be strand or filament like, with large areas completely empty. More work is underway to refine this map so more of the detailed structure can be seen. As well as the CMB, microwaves have allowed us to study a few other things:
How galaxies form and evolve.
Star and planet formation: The stunning image on the left is HL Tauri. This is a proto planetary disc showing the bands around the centre that will eventually become planets to this young proto sun.
Studying the atmospheres of the planets in our solar system.
Searching for signs of dark matter at the centre of the Milky Way.
Finding water vapour being ejected from a black hole 11.1 billion light years away.

Galaxy NGC 1316 or Fornax A. Source National Radio Astronomy Observatory, Image courtesy of NRAO/AUI and J. M. Uson
Radio Waves
You would probably pick the search for intelligent life as the most prominent use of radio waves (SETI) and rightly so, but two of the most compelling characteristics of radio waves is the ability to penetrate through obstructing clouds of dust and gas, and reveal hidden structure to celestial objects. The image on the left is the galaxy NGC 1316, known as Fornax A. The galaxy in the image is just the white spot at the centre. To the right of the white spot is a smaller galaxy being sucked into the larger. This has set the black hole at the centre of Fornax A spinning. We know this because the massive areas of radio emissions either side result from the black hole’s attempt to contain the extra material arriving from the small galaxy.
And Finally
I’ll finish with the image below. This is the Crab Nebula. It is the remnant of a supernova recorded by the Chinese in 1054. The only real image is the visible light one (3). All the rest have colours assigned to the variations in intensity to show the structure of things like temperature and density. The gamma ray version is the one that reveals the neutron star remaining after the explosion. It is only 30 kilometres across and spinning about 30 times a second. Even so it is still 1.4 times the mass of our sun, and a teaspoon would weigh around a billion tonnes.

The Crab Nebula in multiple wavelengths. Source - WIkimedia, Torre997 (for contributions to each image go to https://commons.wikimedia.org/wiki/File:Crab_Nebula_in_Multiple_Wavelengths.png)