Cosmic Staircase 7 - Surface Brightness Fluctuations
It was in 1798 that the French mathematician Pierre-Simon Laplace published his book ‘Summary of the History of Astronomy’. In it he proposed a method of measuring the distance to nearby galaxies. This idea eventually became known as Surface Brightness Fluctuations. However, at the time, the kind of equipment needed to do it had not yet been developed. This was even true in 1955 when two astrophysicists, Martin Schwarzschild and William Baum, revived the idea as a practical method. We had to wait until 1988 for two pioneering scientists, John Tonry and Donald Schneider of MIT and Princeton Universities, to get the ball rolling.

Queen's head showing a close up of the eye where the individual dots can be seen. Source - PublicDomainPictures.net
So what are Surface Brightness Fluctuations?

Tricolour television close up. Source - Wikimedia, Martin Howard
Remember the dot matrix printer? This is a devise that stabbed dots into paper to reproduce computer-generated images. Close up you can distinctly see the individual dots and the spaces between, giving you the maximum range of brightness and overall lumpiness. As you pull back and increase the distance the dots start to merge, but you can still detect that it is made from individual dots, and the range of brightness is reduced. Further back still and the image smooths out until the dots are no longer in evidence. This effect is similar to the images you see on your TV. Close up you can make out each pixel composed of the right ratios of red, green and blue for that part of the image. Pull back and they start to disappear. There is a direct relationship between the lumpiness of an image, its attendant brightness variance, and the distance from the observer.

NASA's Nuclear Telescope Array, or NuSTAR x-ray image of the core of our galaxy. It is the most detailed ever taken. Source - Jet Propulsion Laboratory, NASA/JPL-CAltech
This relationship between degree of lumpiness and distance is the principle behind the study of star fields in galaxies. So this method doesn't measure distances to stars, but to fields of stars in distant galaxies. The benchmark for the rate at which this lumpiness smooths out with distance is the Large Magellanic Cloud (LMC), whose distance has been calculated by other means, including parallax and Cepheid Variables. Essentially this means that this method is calibrated by using the parallax and Cepheid Variable observations of the LMC.
The Hydra Cluster. Source - astronomy-mall.com/adventures in deep space, Steve Gottlieb
The closest star field for this method is the core of our very own Milky Way. The outer surface of the core is around 26,000 light years away. Over time other methods will check the accuracy of these distances. The Gaia space telescope, described in a separate essay in this series will be able to check the distances of individual stars that compose the outer layer of the Milky Way’s nuclear stellar core, known for short as MWNSC.
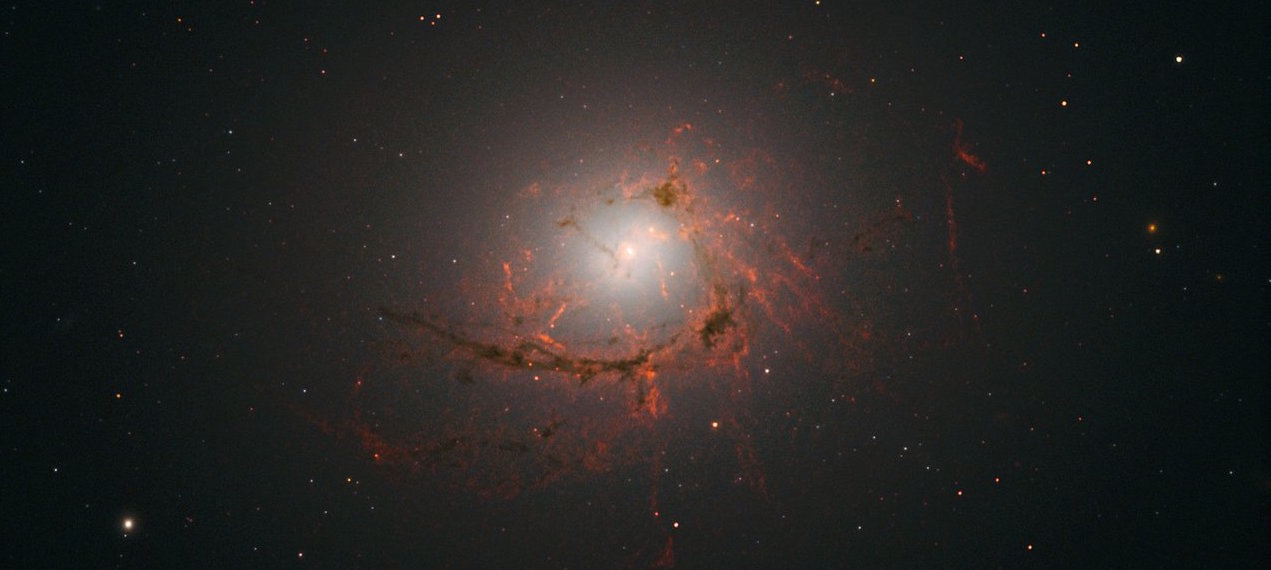
The NGC 4696 galaxy in the Centaurus Cluster. Source - Wikimedia, NASA and the Hubble Space Telescope
The Surface Brightness Fluctuations method calculates the distance to our galactic neighbour, Andromeda, to be between 2.51 and 2.63 million light years. Astronomers have since reached out further into the universe using this method. In 2005 it was used to measure the distance to two well known clusters of galaxies; the Hydra and Centaurus clusters. Galactic clusters are groups of galaxies that are held together by gravitational attraction in the same way that the Milky Way and Andromeda form our local group.
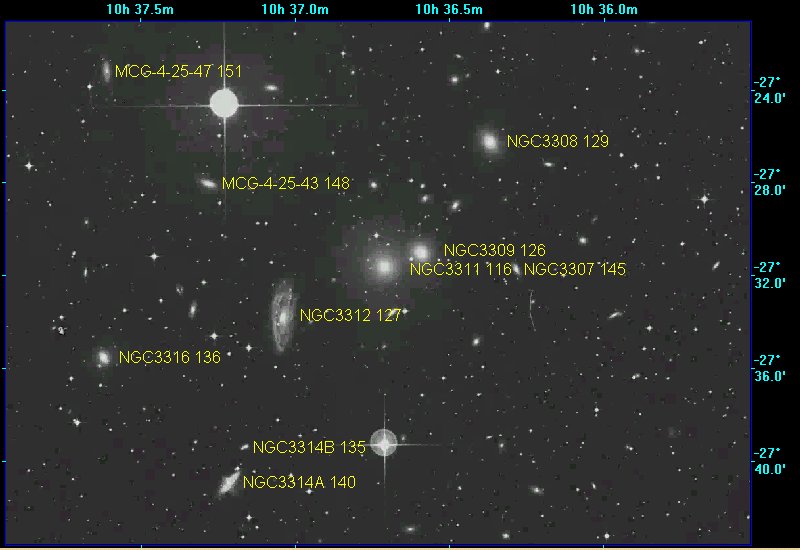
The Hydra Cluster contains 157 galaxies bright enough to be viewed from earth and occupies a region of space 10 million light years across. Three of these are much larger than the rest. NGC 3309 and 3311 are elliptical galaxies, while NGC 3312 is a blue spiral galaxy. Measurements using this method cover these three and 12 of the smaller dwarf galaxies. The average distance is 134 million light years ±3.4%.
The Centaurus Cluster measurements include two large galaxies (NGC 4696 and 4709) and 13 dwarf galaxies. The average distance is 148 million light years ±4.4%.
The Centaurus and Hydra clusters of galaxies are part of a large supercluster call Laniakea. It also includes the Virgo cluster that contains our own Milky Way. The video here describes, with stunning graphics the discovery of the Laniakea Supercluster.
The further away a galaxy is the wider the margin of error. Therefore the calculated distance of the galaxy furthest away using this method is 334 million light years ±13.5%. This isn’t too bad at all.
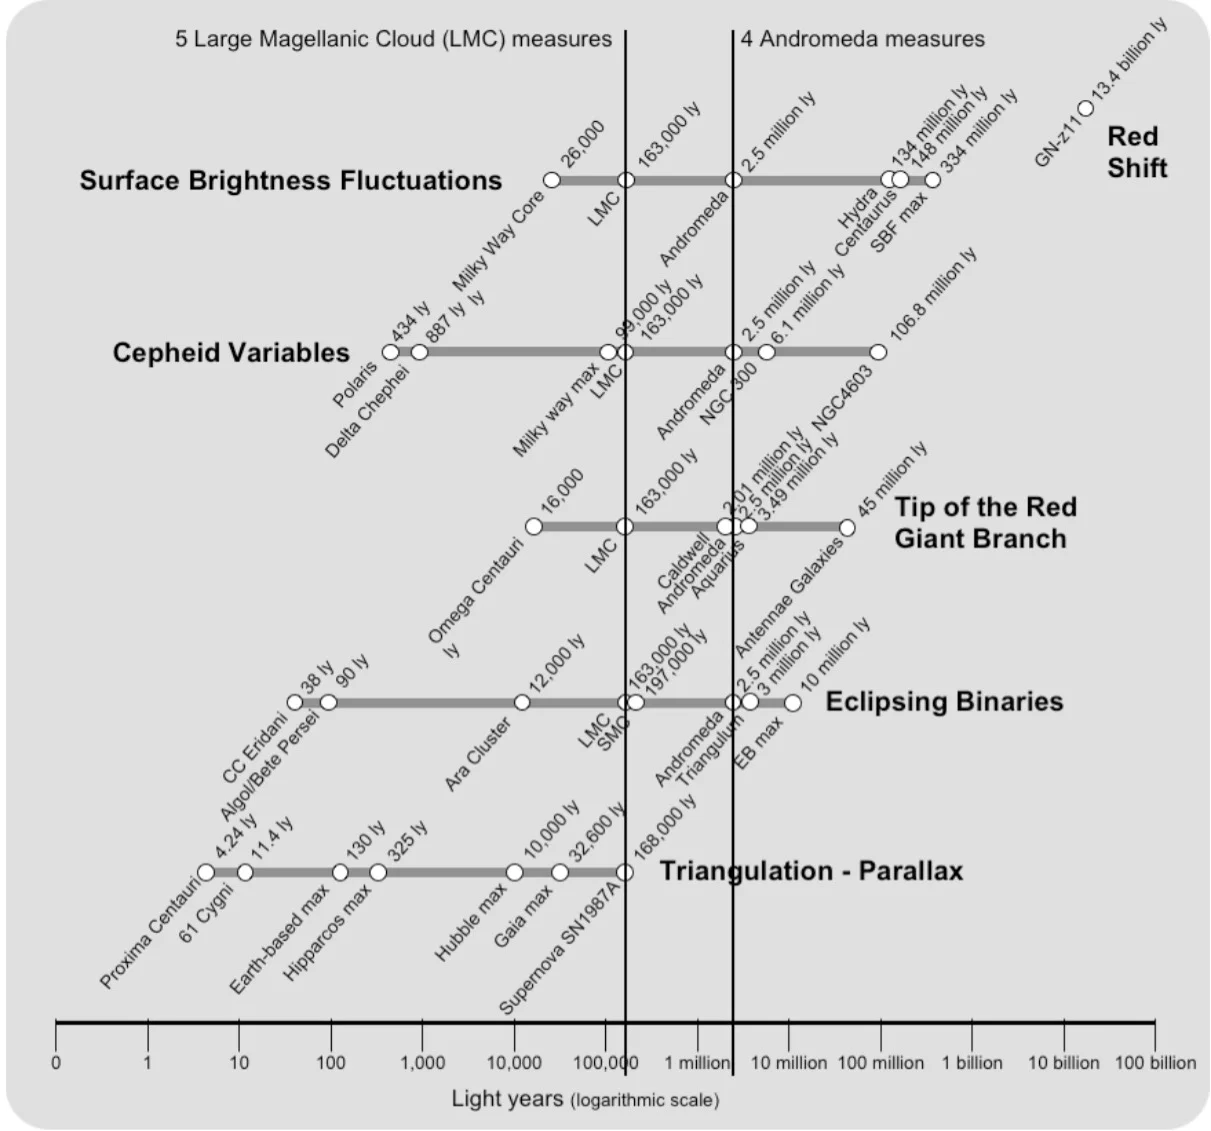
This is the fifth step in our cosmic staircase. The chart bottom left shows the furthest galaxy so far measured by the Hubble Space Telescope using red shift. I haven't written a piece about this yet, and no doubt the discovery of gravity waves will lead to even further advances and yet another article here.