Knowledge Fans
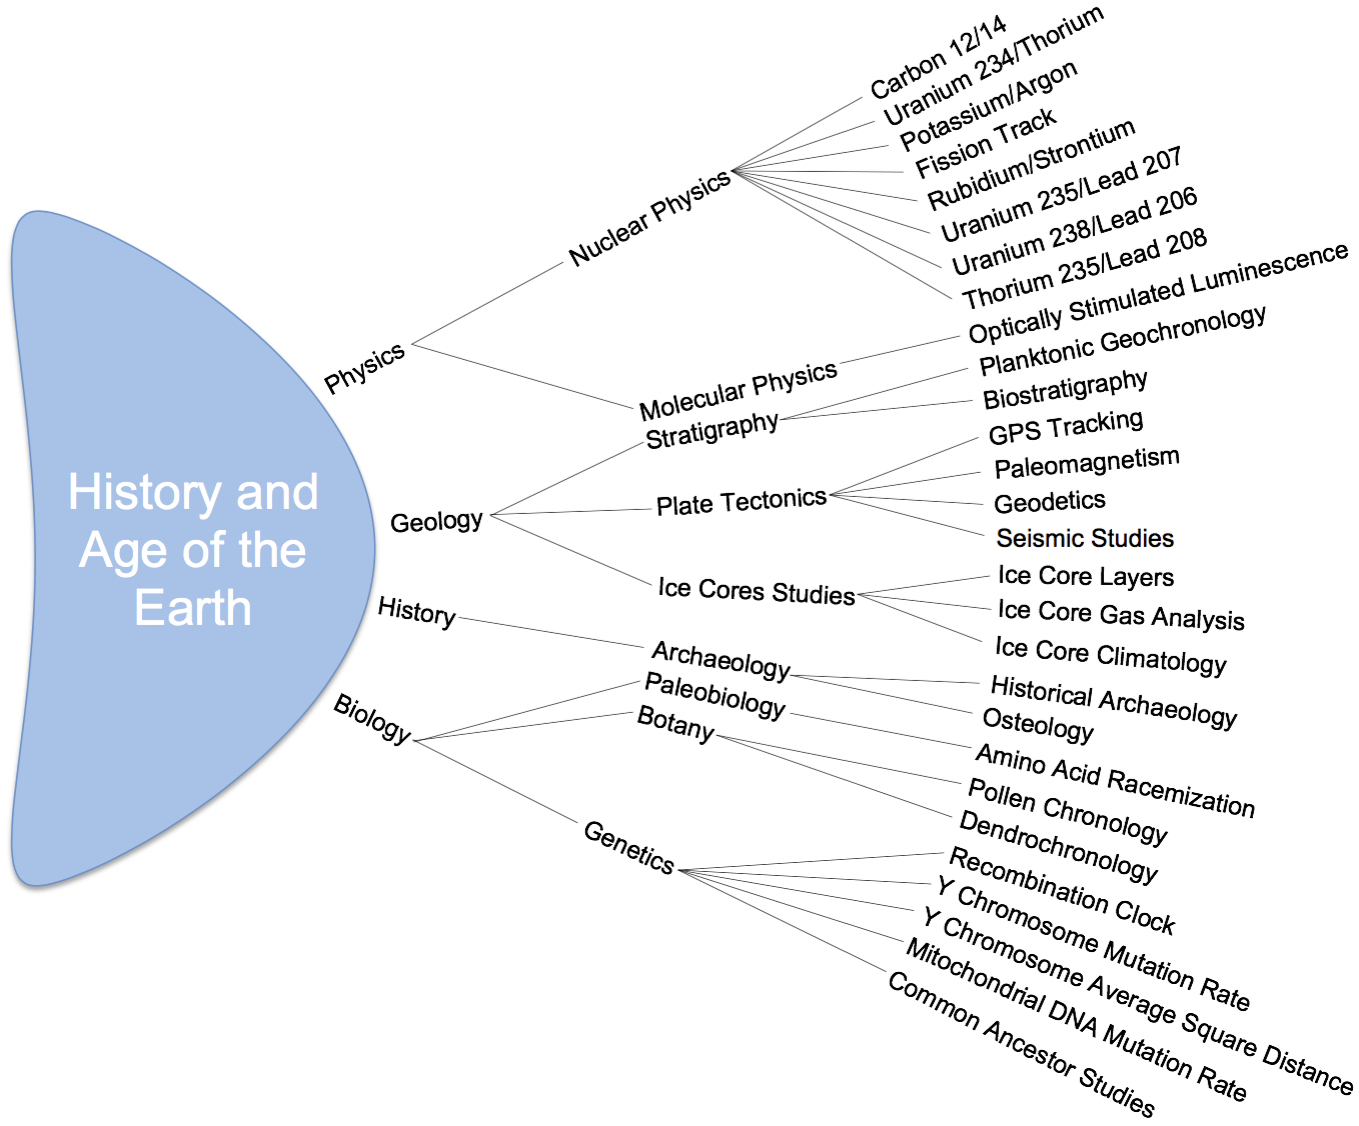
One of the things that has always amazed me about knowledge is the way that it’s all connected up. Knowledge is networked. Trying to remove an individual piece of knowledge from the pile of pieces will always drag up the rest of the pieces in the pile if all relationships are represented by connecting threads (see the video near the end). I wanted to find a way to capture this connectivity, so I invented the “Knowledge Fan.” It was supposed to be a “Knowledge Onion” but my graphics program is rubbish and its the best I could do. I've taken a fairly broad subject, the 'Age and History of the Earth'. The idea behind this is to display all of the independent lines of enquiry and techniques that contribute to the subject, showing at the same time the branches and sub-branches of science from which they emerge. The lines of enquiry and techniques in the chart below is just a snapshot. For a subject as wide as this the right hand side would have many hundreds of items.
The individual techniques link to all others in two different ways:
By contributing to the same objective, in this case understanding the birth and history of the Earth.
By being used for other purposes. For instance DNA analysis can be used for genetic engineering, medicines, medical diagnosis, ancestry and identity verification, as well as tracking migrations and calculating the timelines to common ancestors.
When one of the techniques listed here is used for other purposes it creates a connection from this objective to other clusters of techniques addressing different objectives. Its like a field of spider webs connected to each other by a few of the threads. (again see the video at the end).
Source - Me
Generally techniques and lines of enquiry contribute to the subject in three ways:
Fixing the timeline from birth through the sequence of key stages in the story up to the present day. Getting the dates and sequence right for each chapter.
Providing a description of what each chapter (epoch) was like; climate, chemistry, biology and dynamics of change.
Ensuring that transitions from one chapter in the story to the next makes sense and is consistent with supporting data.
These three types of information must be compatible. Together they should explain how each phase of the story changes into the next. Climate data gleaned from ice cores and tree rings should be consistent with the timelines. Pollen data telling us about the flora at a particular time should match the climate data for that same period. Inconsistencies are rarely left to fester.
I will be writing, and have already written, about some of the above techniques, but it might be useful to briefly highlight a few here.

Source - Me
The group of 8 Nuclear Physics techniques at the top of the fan is discussed in my essay Radioactive Dating . As well as their multiple contributions to the story of the earth, they also overlap with each other. For the important period between 10,000 and 50,000 years ago there are three, so there is a triple check on dates.
Optically Stimulated Luminescence measures ionising radiation from mainly mineral samples and was for example used to date the earliest human Australian remains at around 42,000 years ago, which accords with other data sources that set the timeline for the arrival of humans on that continent.
Planktonic Geochronology studies the changing plankton species through the different sedimentary layers, and this is tied into radiometric dating and consistencies with ancient climate data.
GPS Tracking is able to measure the rate of continental movements, projecting both into the past and into the future. For example it has measured Australia as moving around 7 centimetres a year northwards with a small clockwise twist. This is fast compared with the 2.5 centimetres a year increase between Europe/Africa and the Americas. Using GPS scientists in Nottingham have discovered that Britain is tilting. The North is rising and the South is sinking. That should sort out the North/South divide problem.
Seismic Studies looks at and dates ancient earthquakes by studying the material in their fault lines. This is useful where sea floors are sub-ducted below continental coastlines like the west coast of the Americas, and it contributes to our growing understanding of how mountain chains like the Andes are formed by this process.
Ice Cores can be drilled up to 2 miles deep and reveal layers that go back 800,000 years. Variations in oxygen and hydrogen isotopes tell us about temperature at different times, and trapped air bubbles give us data about the proportion of gases such as carbon dioxide. Depending on the location Ice cores can also identify past volcanic eruptions and a range of contaminants like dust and salt can track changes of climate in the core's location. Places that are now covered by two miles of accumulated ice have been desert in the past. It is amazing to think that we can reconstruct and date past environments from studying ice.
Osteology is the study of bones in archaeology. The information retrieved adds value to the dating of such remains, and includes species, age sex, diet and illnesses. It can even sample DNA and this was famously done to identify bones found at Grey Friars in Leicester as Richard III.
The Problem for Denial
Normally I try to avoid science denial because I end up ranting and it isn't pretty. But its important to address it for this theme. The denial approach is usually to identify science that appears to be vulnerable to sufficient criticism for that bit of knowledge to be rejected. The problem with this is that broad areas of knowledge like the timeline of the earth, cosmic ages and evolution involve very large numbers of independent lines of enquiry. It is both the number and consistency of their evidence that makes it powerful enough to be called overwhelming. When dozens, hundreds and sometimes thousands of different techniques tell roughly the same story the chances of them all being wrong is vanishingly small.
There's an even bigger problem though. Suppose we concede the possibility that they are all wrong? The chances of them all being wrong to exactly the same degree and direction, so that they tell a consistent but incorrect story, is even more vanishingly small. If they were all truly wrong, their wrongness would be all over the landscape.
I think of this as being a bit like a shrimp chewing on a whale; scraping off a bit of skin, eating it and imagining that by so doing it has devoured the entire beast, even to the point of making it disappear. Its a somewhat larger version of the elephant in the room.
Enough about denial. Lets now look at a useful metaphor for the connectivity of knowledge.
The Six Degrees of Separation
The six degrees of separation is about human connectivity. The idea is that any one randomly selected human can be connected through friends and acquaintances by around 6 steps to any other randomly selected human. This is the field of network theory and I will be publishing an essay about that soon. More recently the huge increase in social networking has reduced the average number to less than 4. The link below will take you to a Facebook research page. A distribution graph is about half way down.
https://research.fb.com/three-and-a-half-degrees-of-separation/
The video above right tells the story of how this idea developed and is better than any words I could use. Except to note that it illustrates very well the clustering effect I mentioned at the top of the essay and the smaller number of connections that link the clusters. This phenomenon is named by its identifier, Mark Granovetter, as “The strength of weak ties.” The video is one of a large collection by Derek Alexander Muller, who is best known for his YouTube channel Veritasium with over half a million subscribers.
The principle works in a similar way with knowledge, except that friends and acquaintances are replaced as the link by shared contributions to an evidence base. The clustering mentioned in the video has its counterpart in the way a collection of lines of enquiry cluster around a subject.
There are already some essays written under this connectivity theme. In particular the series called the Cosmic Staircase. Check them out below. The list is in the order they should be read.