Cosmic Staircase 5 - Tip of the Red Giant Branch (TRGB)
No two stars are the same, just like no two people are the same. For a start there are different generations of stars. First generation stars, which started forming 200 million years after the big bang, are all hydrogen and some helium to start with, and pressure and temperature at their cores is high enough to make hydrogen atoms fuse into more helium, releasing enormous amounts of energy, which humans get to enjoy as sunshine. The larger a first generation star, the higher its core temperature and pressure, and the more elements it can produce by fusion. But even the biggest stars can’t get past iron. All the other elements (and that’s most of them) are created by supernovae explosions; exploding stars that create the heavier elements and cast them out into interstellar space. Second generation stars, like our sun, arise out of the accretion of stellar dust, which explains why we have a planetary system with all the heavier elements included, and also why it is much younger that the overall age of the universe (4.6 billion compared to 13.8 billion years).
So the character of stars differs by variations in mass, composition, age and how they interact with the rest of the universe, especially their nearest neighbours.
Most of the stars in the universe follow a life cycle known as the “Main Sequence.” This emerges in a plot (below) known as the Hertzprung-Russell, or HR diagram in honour of the scientists that devised it. Ejnar Hertzsprung was a Danish Astronomer working at the Leiden Observatory in the Netherlands and Henry Norris Russell an american astronomer working from Princeton University. Between 2011 and 2013 they devised the HR diagram to classify and describe the evolution of different stars. It plots a star’s brightness against its surface temperature. 90% of stars stay on the main sequence throughout their life cycle, becoming progressively hotter and brighter (bottom right to top left).
The stars we are interested in for this distance method are those more than 1.8 times the mass of our sun. These follow a very different path to main sequence stars, and they do this in four stages.
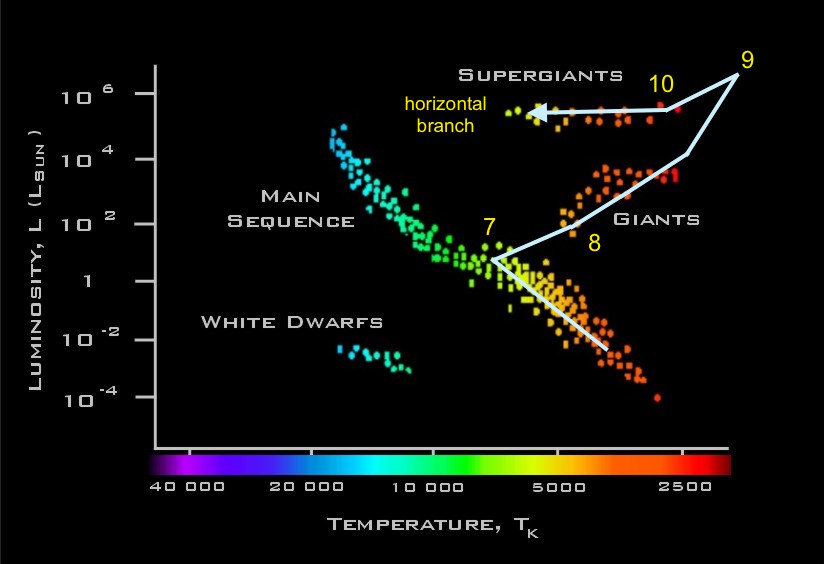
The HR diagram showing the main sequence of star formation and life history (bottom right to top left). Stars with a mass greater than 1.8 time our sun leave the main sequence (7) and eventually populate the horizontal branch.
(up to position 7) Hydrogen fusion to helium in the core. The star is at its most conventional, lying on the ‘Main Sequence’.
(positions 7 to 9) Once the hydrogen at the core has been exhausted, leaving just helium, hydrogen fusion continues in a shell around the helium accumulating more helium in the core as it goes. In this phase the star’s luminosity increases despite a reduction in its surface temperature. The increase in luminosity arises because, even though the temperature is lower, the star has become much bigger, expanding from a sub-giant to a full-blooded red giant star. It is this increase in brightness that takes it off the main sequence.
(positions 9 to 10) At a certain point the star has enough temperature and pressure at its core to start helium fusion to lithium and beyond, and both the surface temperature and brightness fall, bringing it back slightly towards the main sequence.
(from position 10) The final state is called the Tip of the Red-Giant Branch. Its most important characteristic is that its intrinsic brightness remains steady no matter what its temperature or composition. It is called the horizontal branch because these stars remain level at a brightness around 100 times the brightness of our sun.
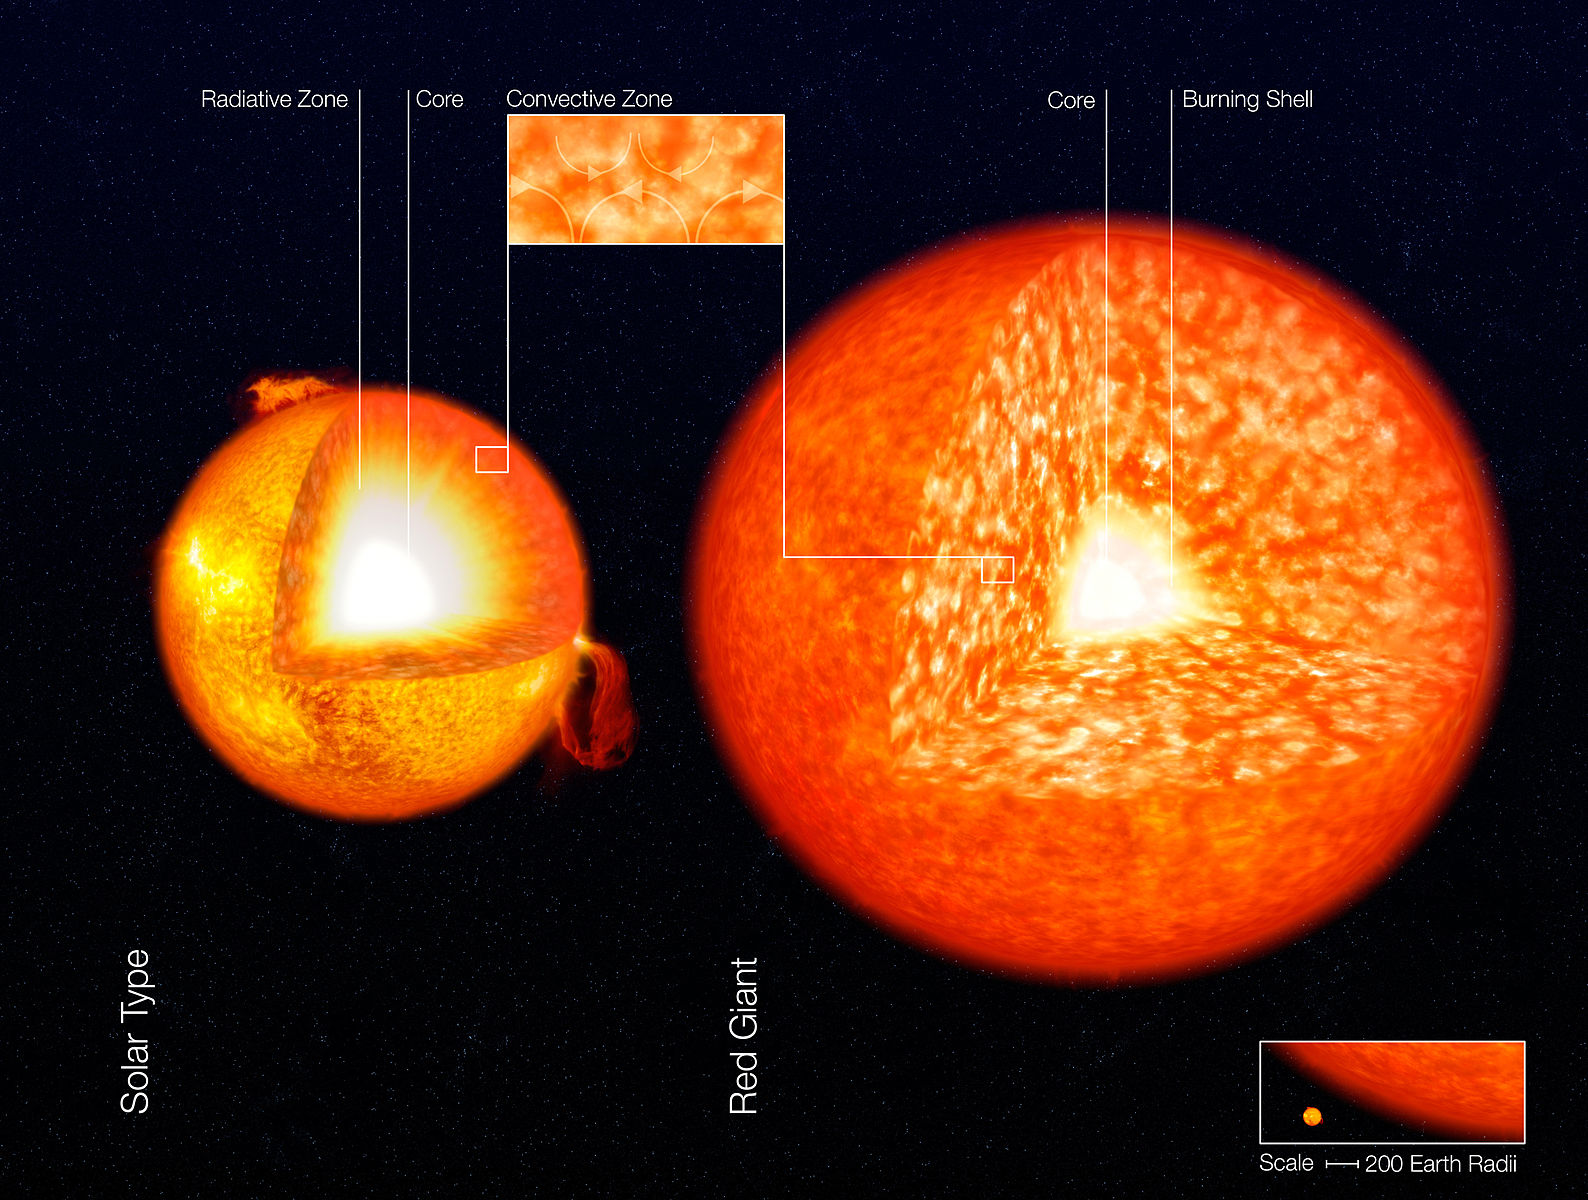
Difference between a red giant and a star like our sun. Our sun converts hydrogen to helium, but the red giant, after converting all the hydrogen at the core creates a shell of burning hydrogen around a helium core. Source - Wikimedia, http://www.eso.org/public/images/eso0729a/
What makes this an accurate method for establishing distance is that we know what their intrinsic brightness is, and we can check it against several other distance methods, including parallax. Even better, these stars are so bright they can quite easily be detected in galaxies up to over 40 million light years away.
Because we know the intrinsic brightness (how bright it really is at the surface), we can use the inverse square law of brightness fading by the square of the distance to work out how far away it is. It is one of the most accurate of the distance methods, contained well within ± 5%.
Large Magellanic Cloud (LMC)
In the late 1970s Dennis Zaritsky, Professor of Astronomy at the University of Arizona, together with four other scientists, carried out the massive task of cataloguing the stars in both the Small and Large Magellanic Clouds. The project was called the Magellanic Clouds Photometric Survey. In 1999, Shoko Sakai of the University of California, published a paper on red giant stars from this survey. She used the data on TRGB stars to calculate the distance to the LMC. This came out at 170,000 light years ± 4%.

Andromeda and its satellite dwarf galaxies. Source - Wikimedia, Andrew Z. Colvin
Andromeda and its Satellites

NGC185 or Caldwell 18. A small companion galaxy to Andromeda, and 550 million light years closer to the Milky Way. Source - Wikipedia
In 2004 a group of six astronomers published their TRGB study of Andromeda and its many satellite galaxies, All of them forming part of our local group. This is a very good example of how scientists collaborate around the world. The astronomers were not located in one place. There were two from the institute of Astronomy in Cambridge, and the others from the Max Planck Institute in Germany, The Strasbourg Observatory, the Institute of Astronomy in Sydney and the University of Hertfordshire Physical Sciences Department in Hatfield. Together they studied most of Andromeda’s Satellites.
Distances ranged from Caldwell 18 (NGC185) at 2.01 million light years, to the Aquarius galaxy at 3.49 million light years, which is the most isolated of the local group. Andromeda itself is 2.56 million light years away. Altogether they measured the distance to 17 members of the local group with margins of error averaging an excellent ±3.5%.

The Antennae Galaxies, 45 million light years away. Source - Wikimedia, http://www.eso.org/gallery/v/ESOPIA/Galaxies/phot-09a-02-normal.jpg.html
And Beyond
The furthest galaxy measured by this method is an unusual one. Its official numbers are NGC4038 and 4039. The reason why it has two numbers is that it is two galaxies interacting with each other. They are called the Antennae Galaxies, in the constellation Corvus and are 45 million light years away. It was originally discovered by William Herschel in 1785 and is going through what is call a starburst phase. The intermingling of the two galaxies causes collisions of clouds of gas and dust, which accelerates star formation.
This method isn’t generally used to determine the distance to stars in our own galaxy. On the other hand they have provided the means to accurately calibrate the TRGB method.
The Omega Centauri globular cluster (NGC 5139) is an unusual cluster of older stars thought to be the remnant of a separate dwarf galaxy absorbed into the Milky Way. The stars in this cluster are very close together, with an average distance of one tenth of a light year. The nearest star to our sun is 43 times further away than that. The cluster contains many TRGB stars whose distances have been established by several other methods at around 16,000 light years. These stars have made it possible to calibrate the TRGB method, making it one of the most accurate for measuring galaxies up to 45 million light years.

This is the third step in the staircase ranging from the Omega Centauri Globular Cluster through most of the galaxies in our local group, and on to the twin Antennae Galaxies.